What is the WhiteBIT Analytical Dashboard?
It is an essential data page that provides an in-depth view of your exchange account's performance and status, offering a user-friendly interface to manage it effectively. Whether you're a seasoned trader or just starting with crypto, the Analytical Dashboard equips you with the insights and control needed to make smarter, data-driven decisions.
Using WhiteBIT Analytical Dashboard you can follow your Balance status, Profit and Loss (PnL) statistics, VIP Program level, trading commissions, WhiteBIT Coin (WBT) holdings, Referral Program earnings, and much more.
Key Benefits of Analytical Dashboard
The Analytical Dashboard enhances asset management, provides in-depth analysis and reporting, and improves overall crypto trading efficiency. Here’s a closer look at the key benefits this page brings to your trading experience:
- Asset Management: Analytical dashboard offers robust digital asset management tools, empowering users to make informed, data-driving decisions and optimize their crypto portfolio to achieve financial goals.
- Transparency and Control: Analytical dashboard delivers transparency and control over the user's account. You can easily monitor and manage your account activities, from balance status to trade volume and referral program statistics. In addition, from the analytical dashboard, you can quickly navigate to a trading platform or WBT Boost page.
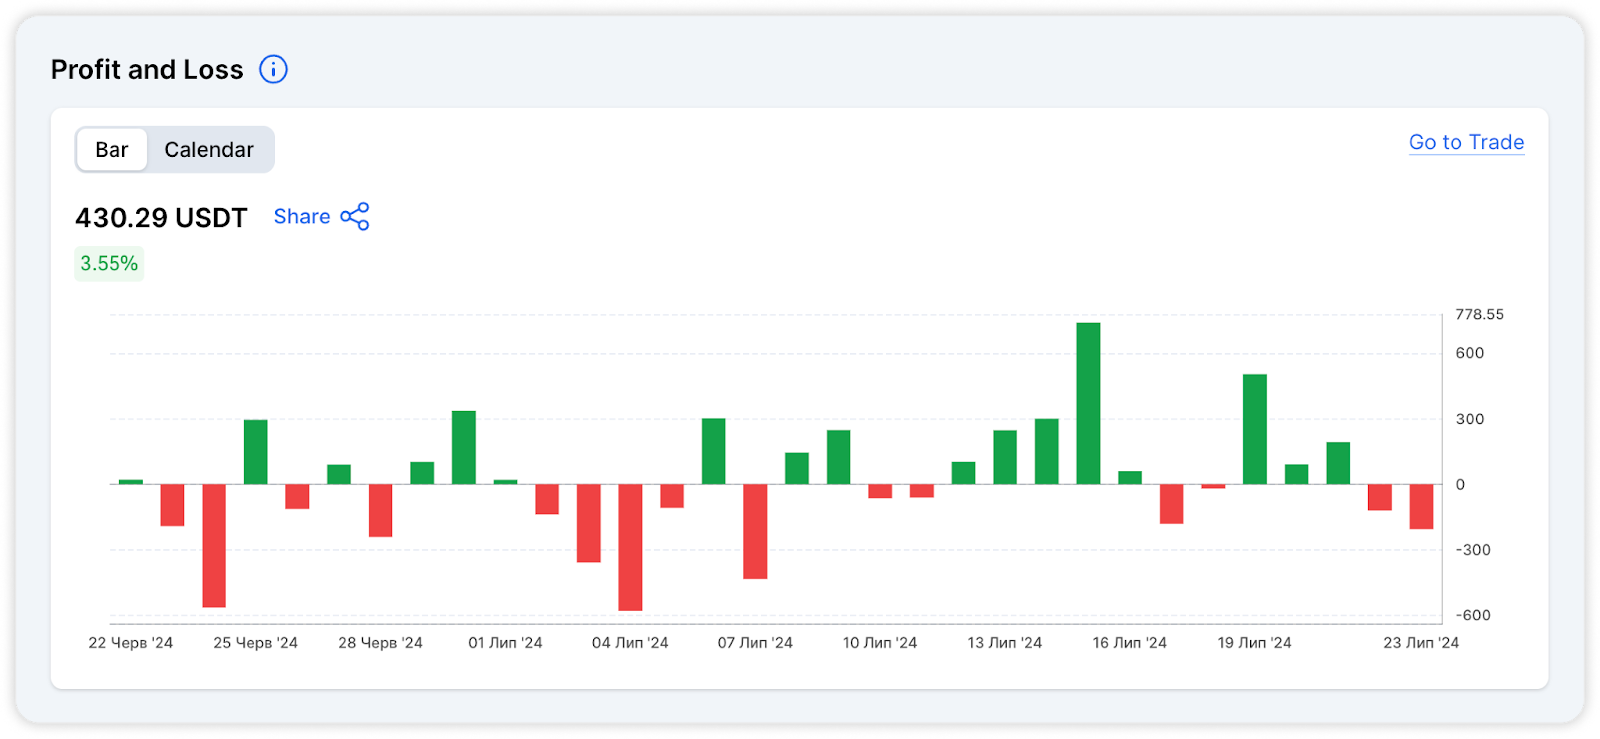
- Analysis and Reporting: One key advantage of the analytical dashboard is its ability to analyze Profit and Loss (PnL) data and trends over different periods. This functionality enables users to gain a more in-depth understanding of their trading performance, identify patterns, and adjust their strategies accordingly. You can make data-driven decisions to enhance your trading and investment performance with access to detailed reports and visualizations. You can read more about PnL in our blog article "What is Profit and Loss (PNL), and How to Calculate It?".
- Strategy Improvement: Analytical dashboard provides access to detailed data and insights, enabling users to continuously improve their trading and investment strategies. Whether analyzing PnL data, studying asset performance, or tracking Referral Program metrics, users can refine their approaches and make informed decisions to maximize their trading potential.
- Improved Trading Efficiency: Analytical dashboard enhances trading efficiency by offering more accurate data directly within the exchange. This eliminates the need for third-party resources, streamlining the decision-making process.
- Access to Historical Data: Analytical dashboard's valuable feature is the ability to analyze past trades. Users can identify successful strategies and learn from past performances by reviewing historical data. Users can view the data as a bar chart and get data for a specific period. A "Share" button also allows users to share this data with others immediately.
- User-Friendly Interface: Analytical dashboard boasts a user-friendly interface that provides a complete overview of all user activity on a single screen. Its intuitive design makes the analysis process fast and easy, even for novice traders. By simplifying the complex data into an accessible format, the dashboard ensures that all users can effectively utilize its features to optimize their trading activities.
Exploring Essential Tabs of Analytical Dashboard
The Analytical Dashboard features three primary tabs for comprehensive financial management:
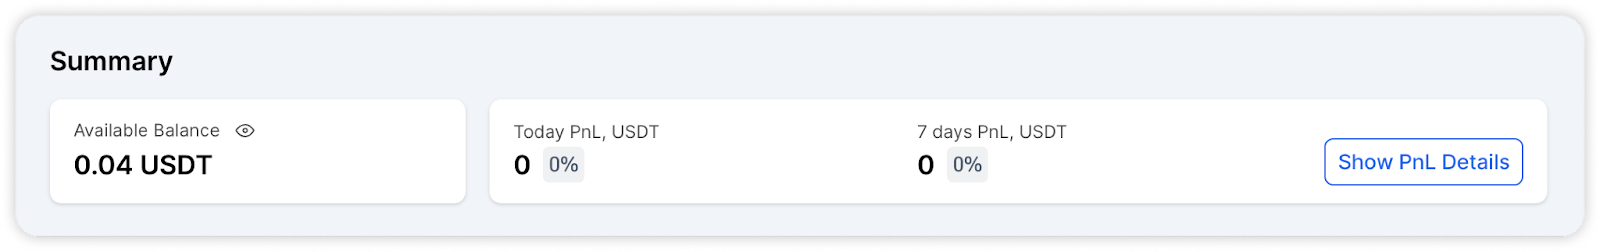
The "Total Balance" in WhiteBIT's Analytical Dashboard is designed to provide you with a comprehensive and detailed view of your trading performance.
This tab includes several essential features:
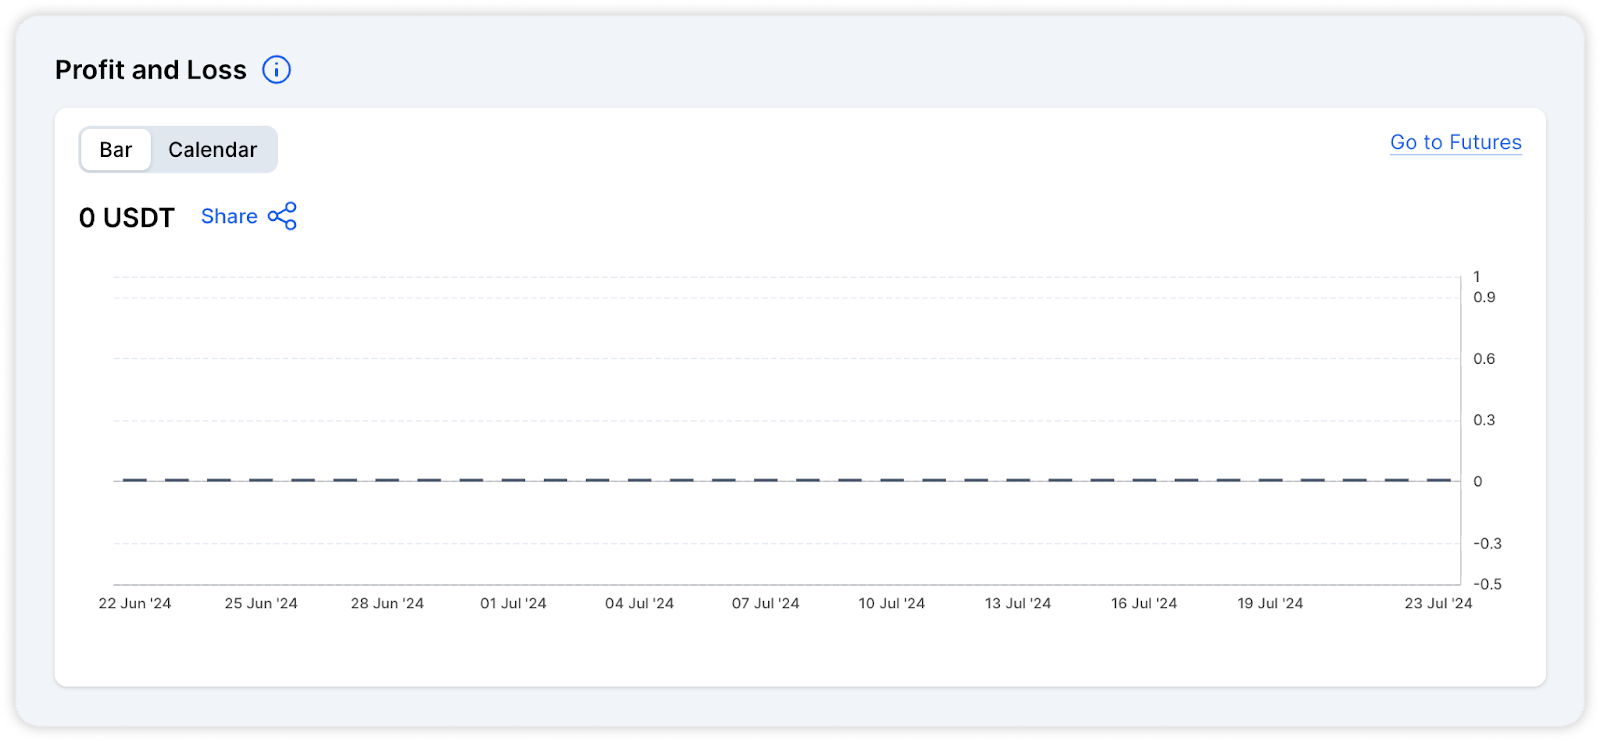
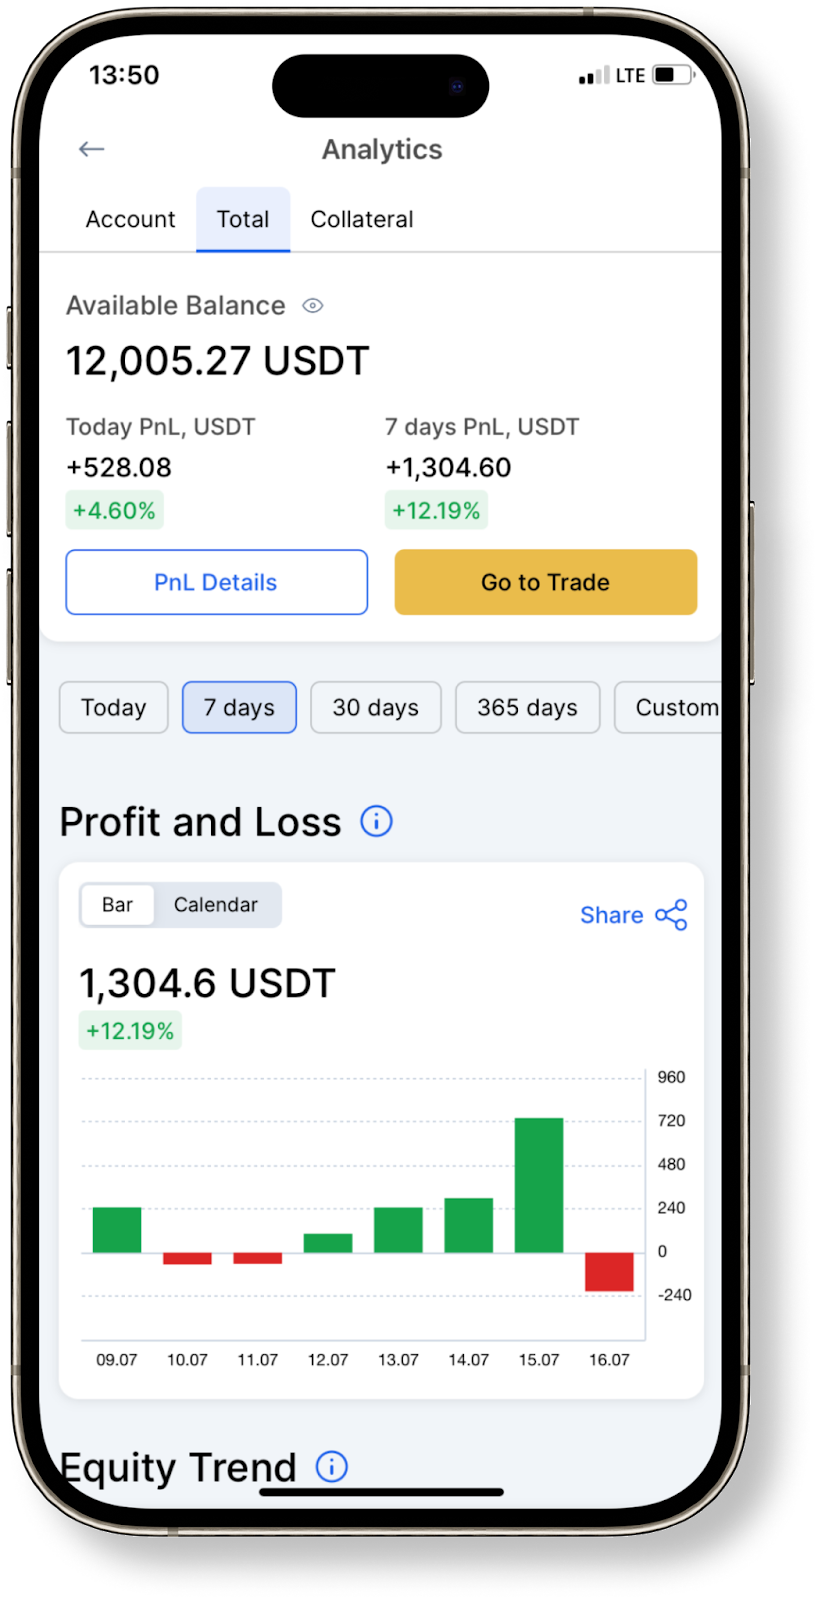
- Display of PnL by balance for different periods — this feature allows you to analyze trading performance over various periods, helping to understand profitability and make informed trading decisions. The PnL data is visualized through interactive dashboards, which include bar charts and calendars. The dashboards can be shared, allowing you to collaborate with others.
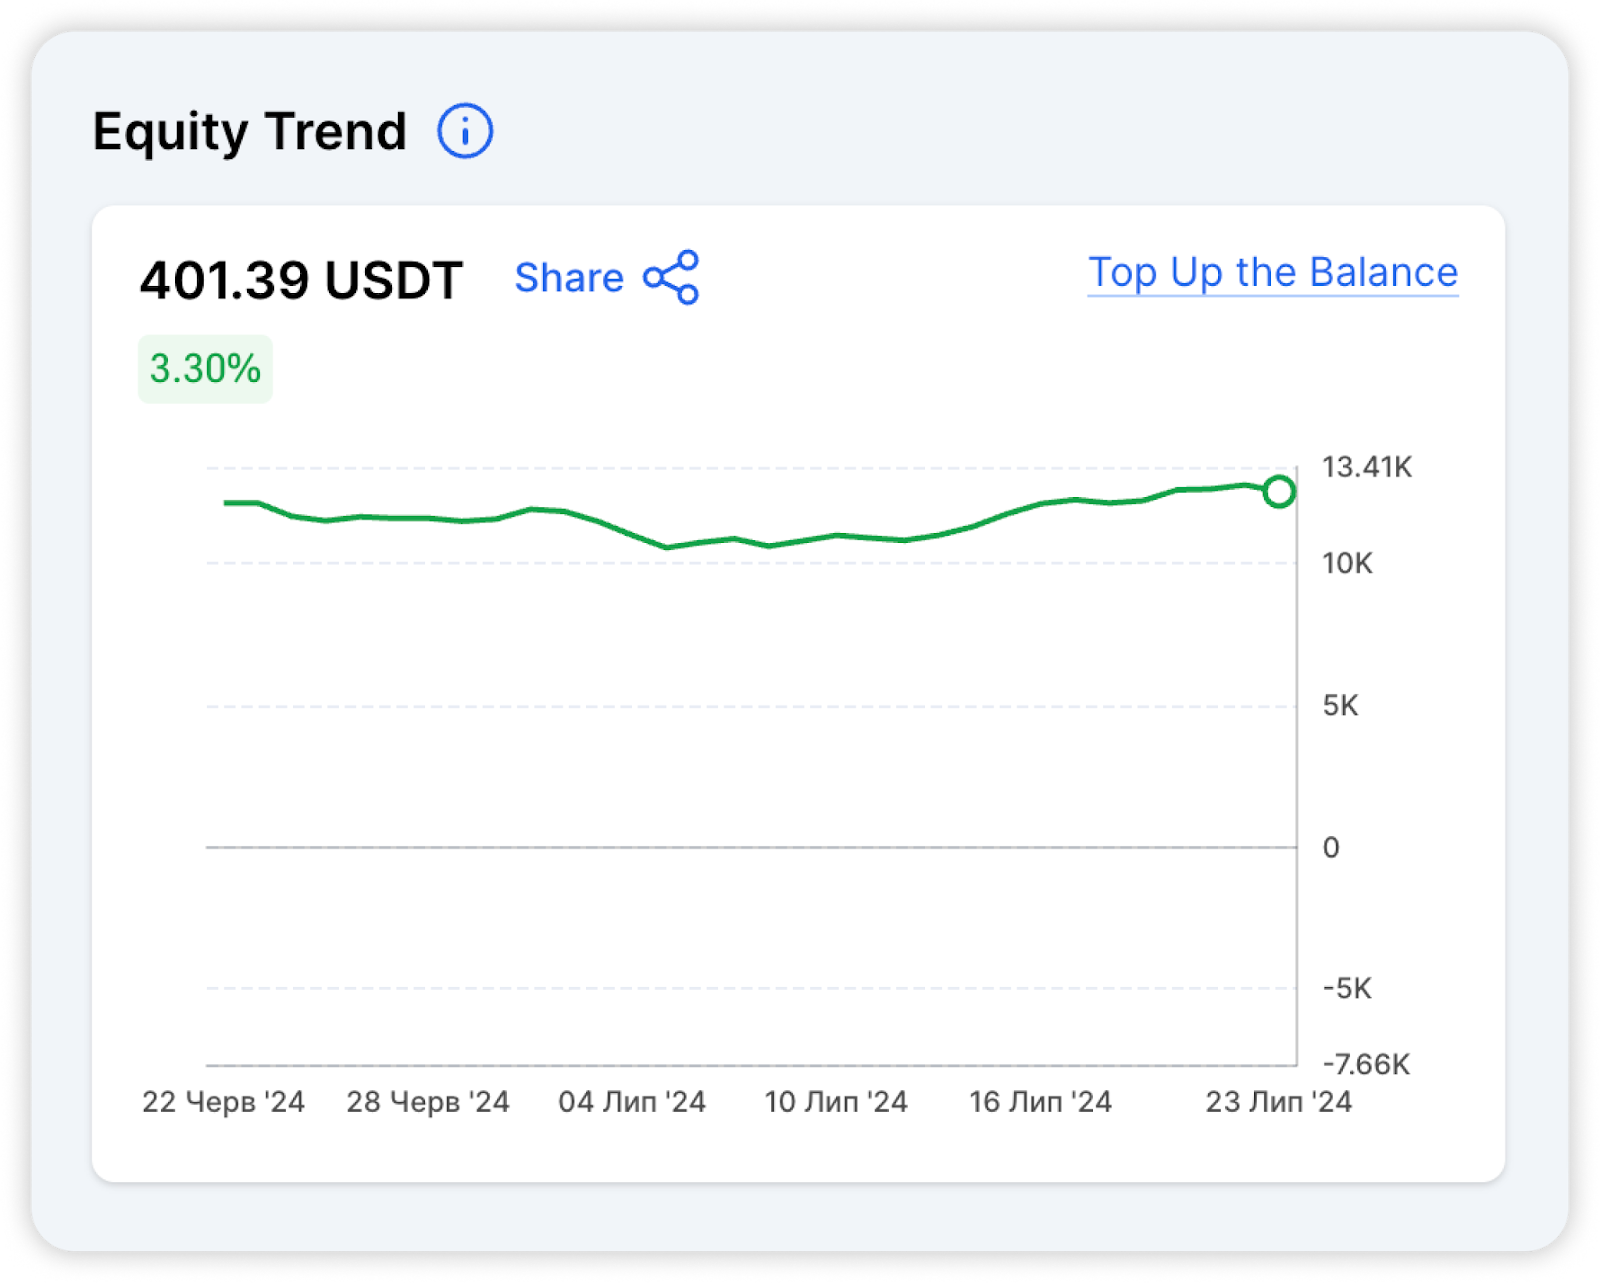
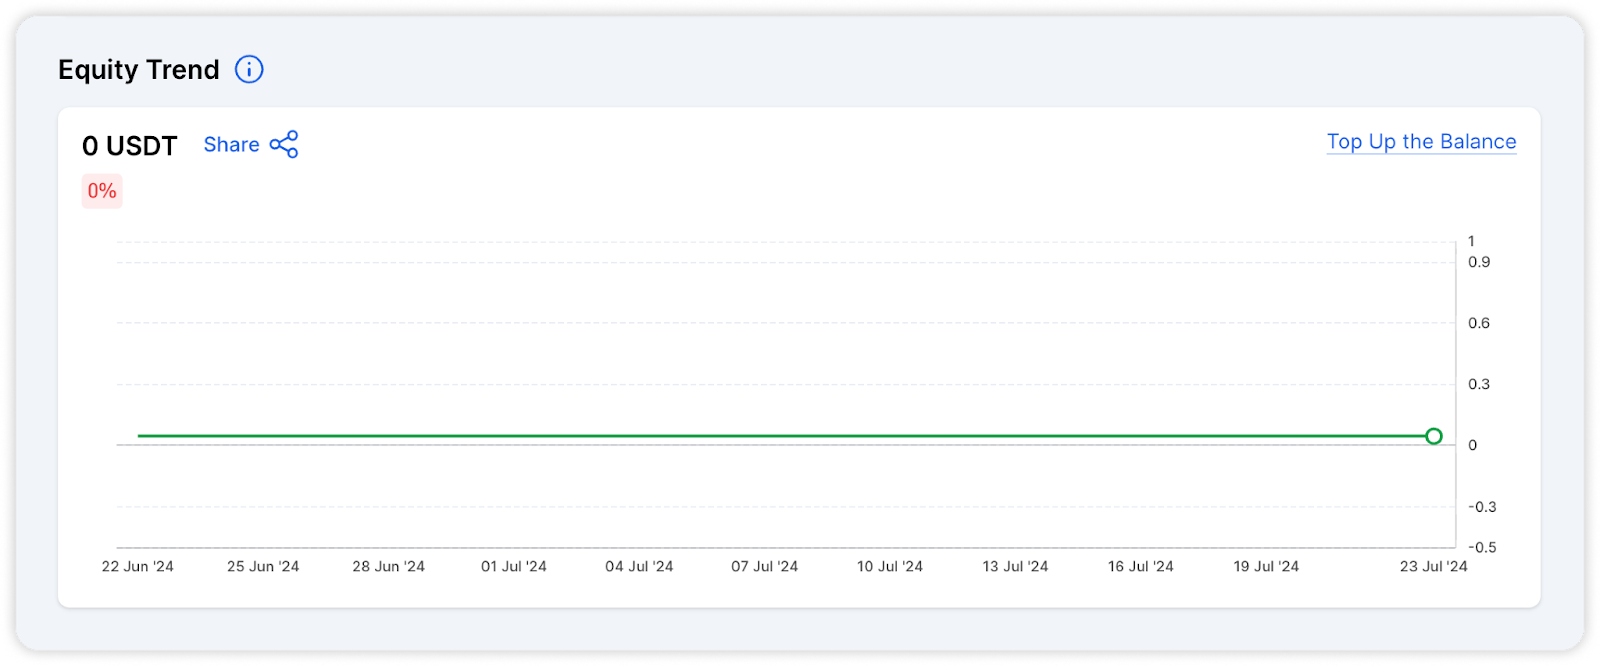
- Balance trend display (Equity Trend) — this feature visualizes the trends in balance changes over time, allowing you to track the fluctuations and patterns in your account balance. The equity trend display includes the ability to screen specific timeframes and provides a direct link to the top-up page, enabling you to add funds to your accounts seamlessly.
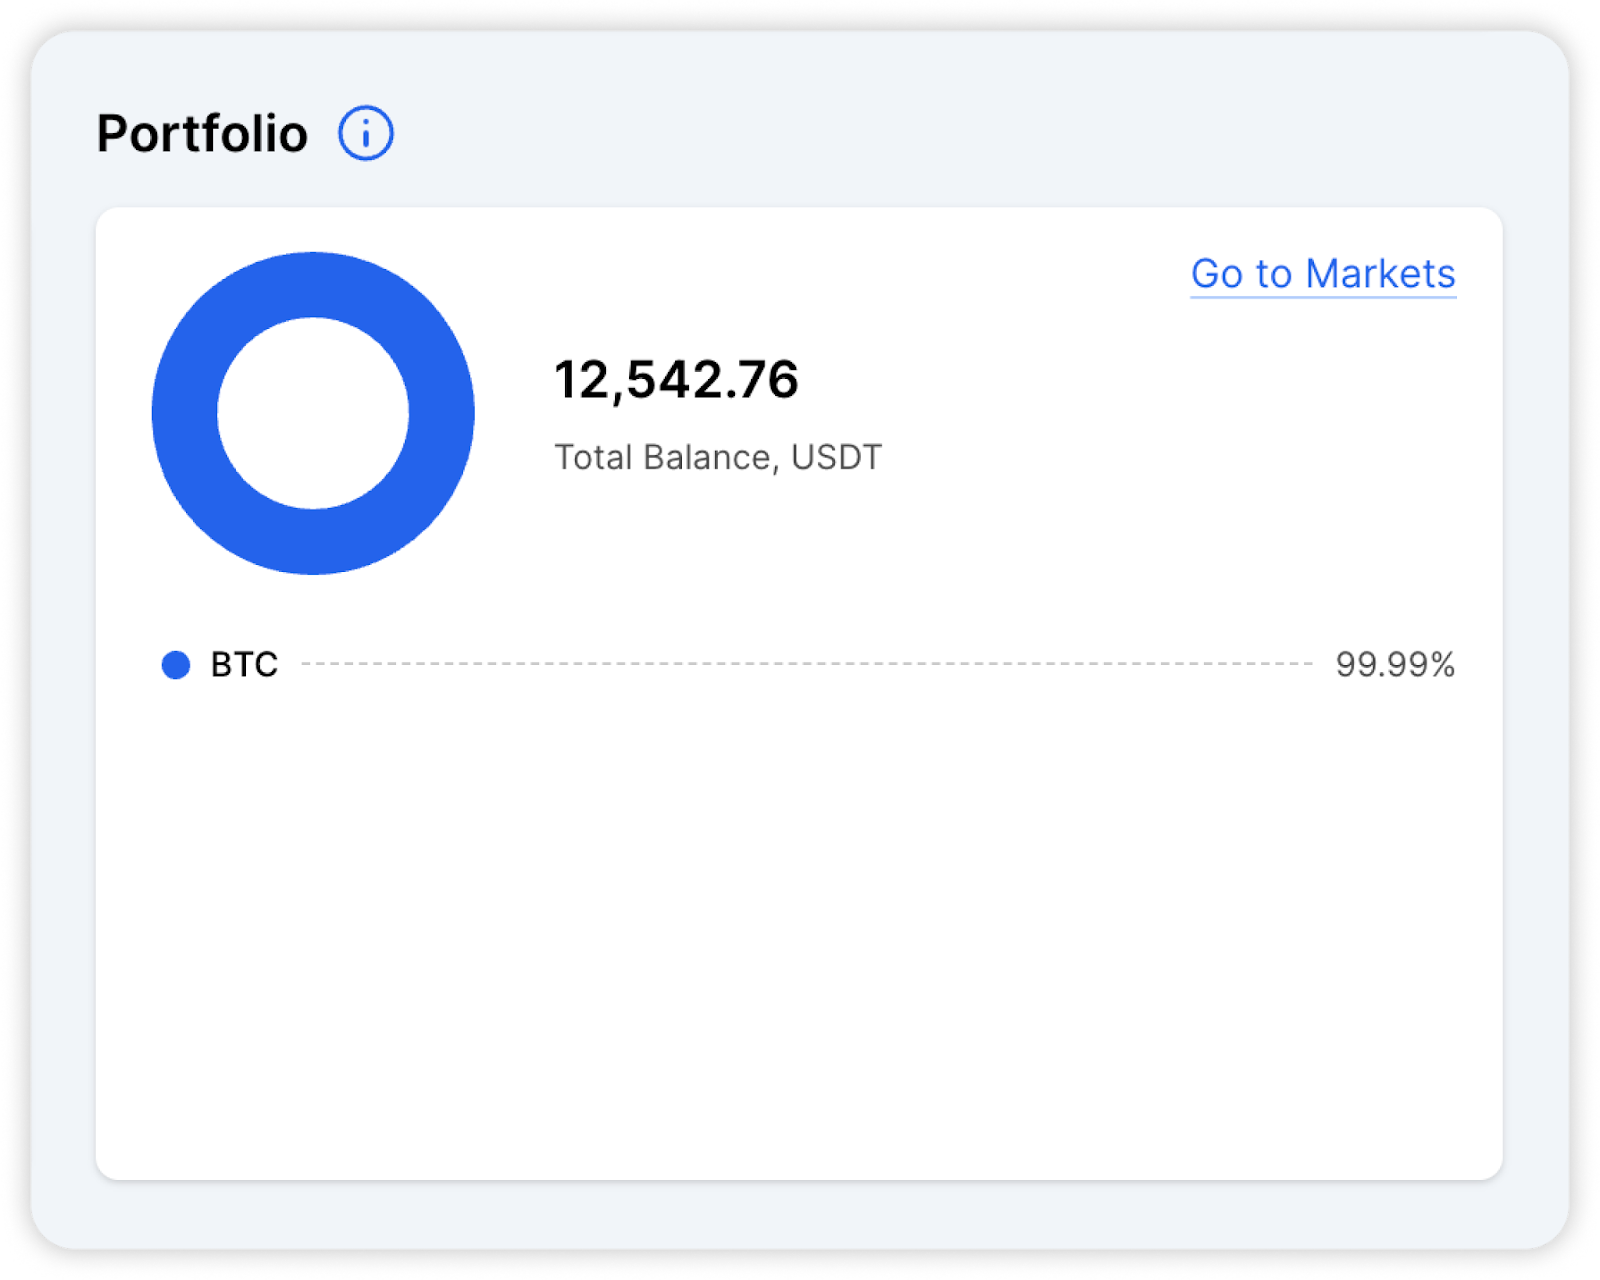
- Asset portfolio display — this tab provides detailed information on the distribution of the overall balance by asset. It highlights the top four assets in your portfolio, offering insights into asset allocation and performance.
The "Account" tab in WhiteBIT's Analytical Dashboard provides comprehensive information about your account status.
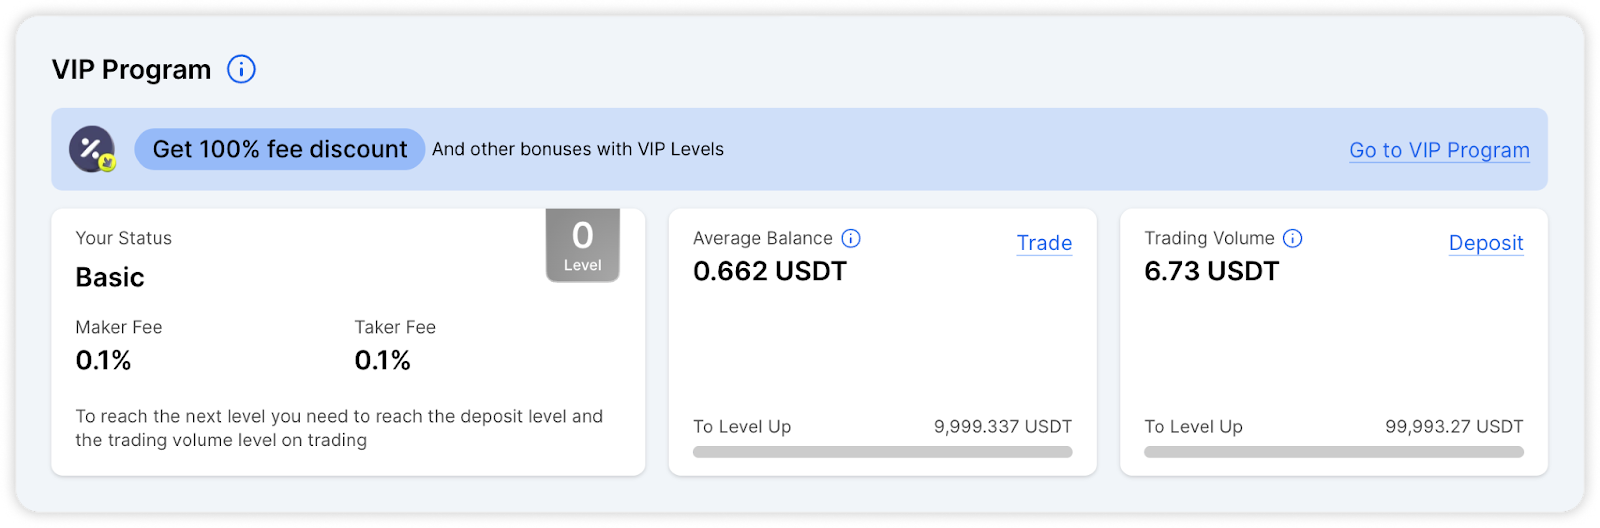
- VIP Program Level — this displays your current VIP Program Level, detailing its benefits and associated privileges. It includes information on how much digital assets need to be purchased to increase your VIP level and decrease trading fees. Read more about it on the "VIP Program" page and in our article at the link.
- WBT Holding Statistics — access detailed statistics on your WhiteBIT Coin (WBT) holdings. The dashboard shows how much WBT you own and hold and the required amount to move to the next level. Find out more about all the benefits on the "WBT Overview" page and in our article at the link.

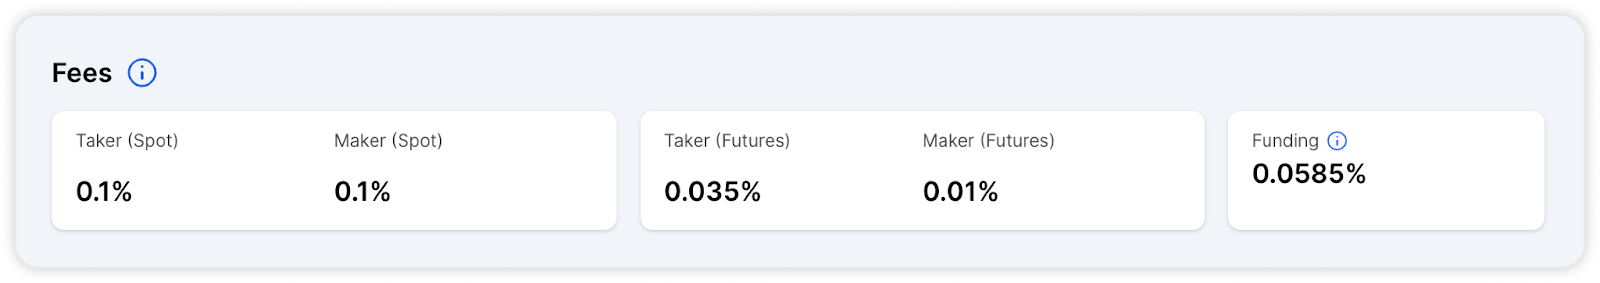
- Trading Fee Rates — information on your current trading fee rates, including Maker and Taker fees. Users can see their eligible discounts based on their VIP and WBT Levels.
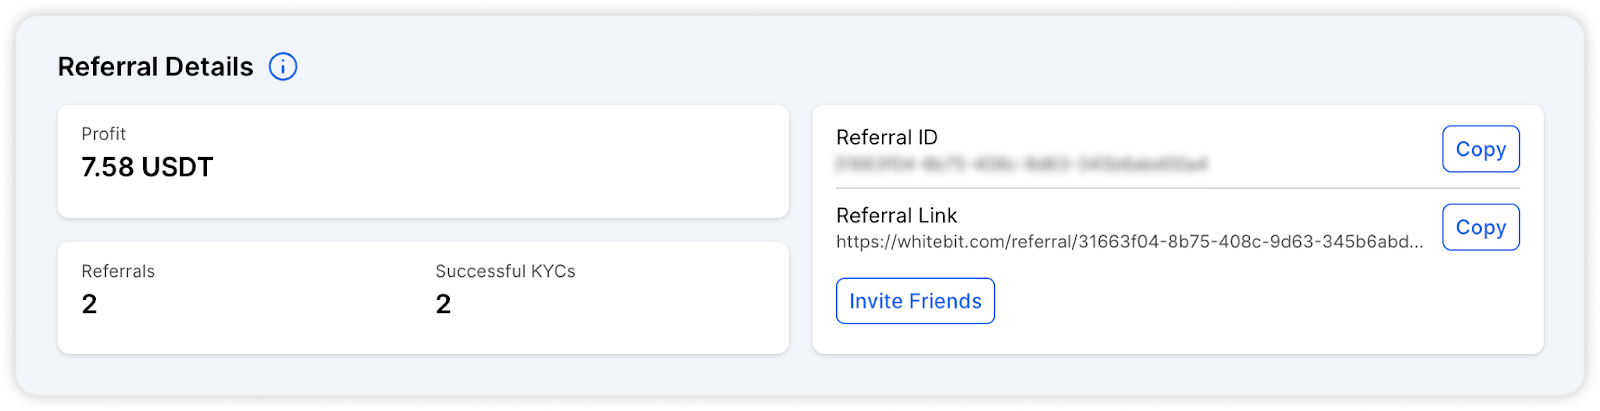
- Referral Program Status — view your participation status in WhiteBIT’s Referral Program. The dashboard displays the number of users you have referred, the income generated from these referrals, and other relevant metrics. Learn more about all the benefits on the "Referral Program" page and in our article at the link.
The Collateral Balance tab in WhiteBIT's Analytical Dashboard provides detailed information about your collateralized assets.
- PnL Insights — PnL data specifically for Collateral balance. This feature allows for a detailed financial performance analysis over various periods.
- Equity Trends — visualizes changes in collateral balance over time, known as equity trends. By displaying these trends, you can track fluctuations and patterns in your collateral balance, aiding in strategic decision-making.
- Trading Performance —this section provides insights into the trading performance of collateralized assets. You can view collateral balance, compare PnL for different time intervals, and select a specific trading pair for which statistics will be displayed.
Analytical Dashboard Features
- Comprehensive Portfolio Display: In the "Total" and "Collateral" tabs of WhiteBIT's analytical dashboard, you can access and share detailed information regarding your available balance, as well as Profit and Loss (PnL).
PnL is a crucial financial metric that helps determine the profitability of investments or trading activity by calculating the difference between expenses and earnings. It provides a clear picture of your profitability over time, enabling you to adjust your strategies based on historical performance.
In the "Show PnL Details", you can visualize their PnL through interactive dashboards comprising graphs and calendars. These visualizations comprehensively represent PnL data, facilitating analysis and interpretation. Moreover, you can scale the graphs and calendars to focus on specific timeframes or data points, enhancing the granularity of their analysis.
The "Equity Trend" display also presents trends in the overall balance change over time. This visualization enables users to identify patterns and fluctuations in their account balance, aiding in strategic decision-making. Moreover, users can navigate directly to the top-up page from the "Equity Trend" display, streamlining the process of topping up funds as needed.
- Viewing VIP Levels and Associated Commission Rates: VIP Program offers significant advantages to high-volume traders. Analytical dashboard displays your current VIP Level and trading commission rates, providing essential information on how much digital assets need to be purchased to increase your VIP Level and decrease trading fees.
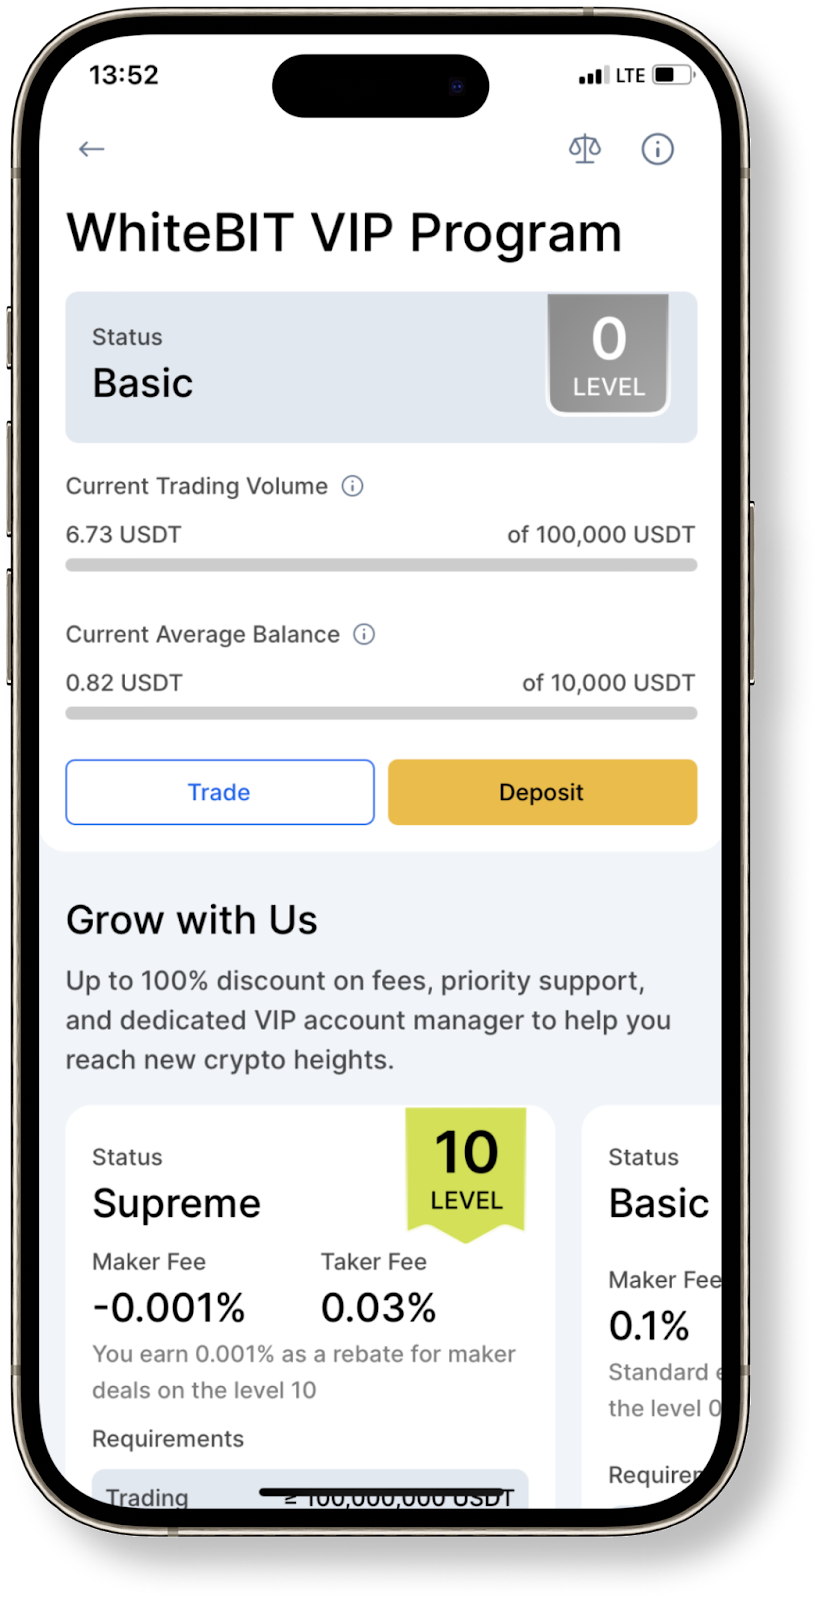
The VIP Program rewards active traders with up to 100% discounts on trading fees, priority support, and a dedicated manager. As your monthly trading volume and balance increase, you unlock exclusive discounts and automatically receive the benefits of a higher VIP level. Read more about it on the "VIP Program" page and in our article at the link.
- Statistics on Owning and Holding WBT: Access detailed statistics on your WhiteBIT Coin (WBT) Owning and Holding status through the analytical dashboard.
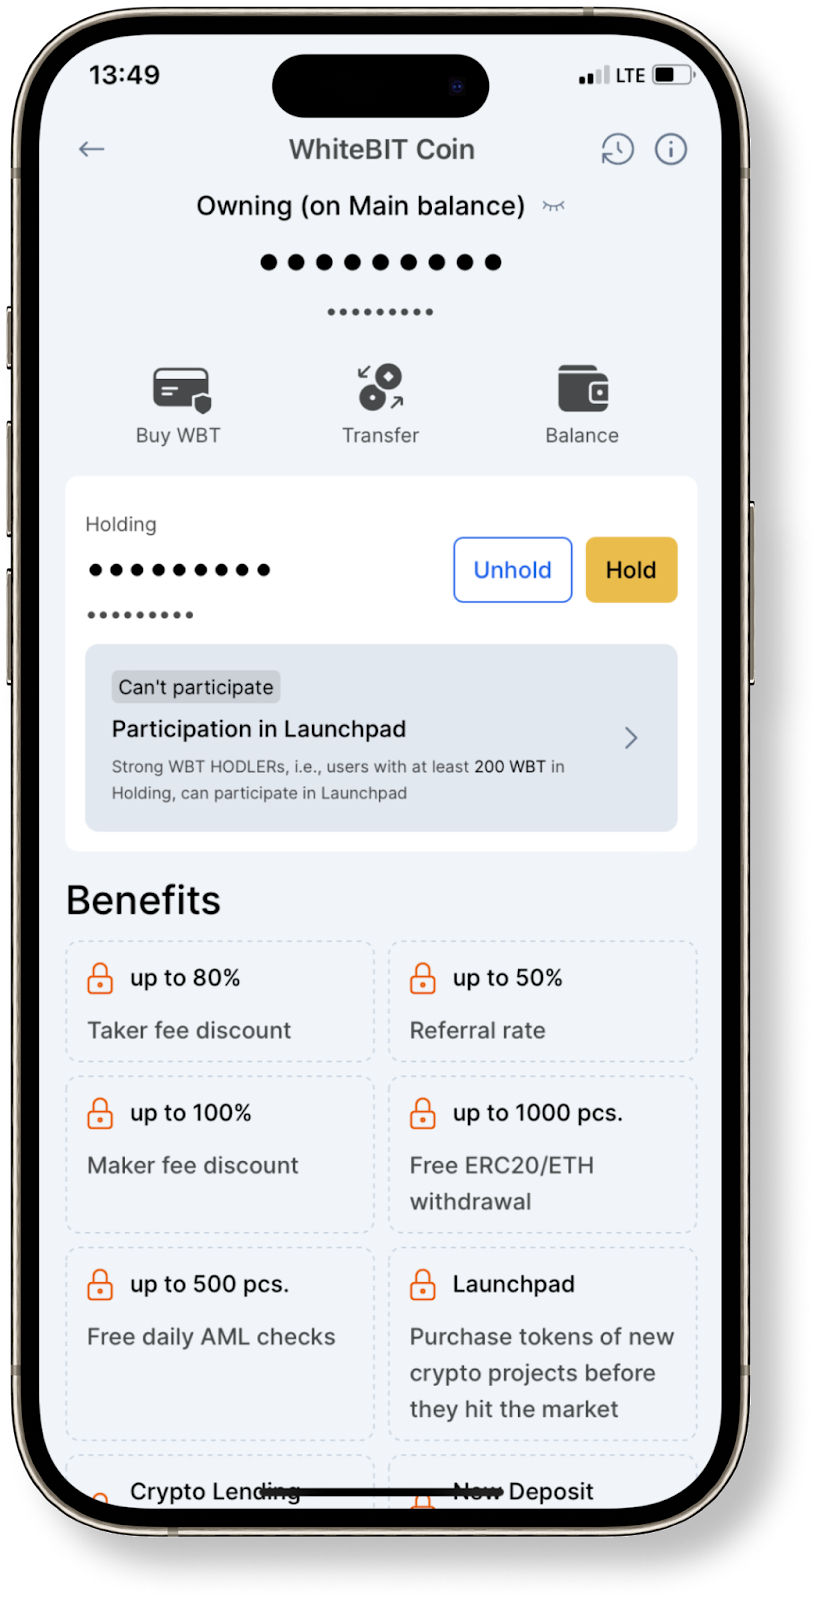
WBT provides many benefits to users, such as an up to 100% discount on trading fees, daily free AML checks, fee-free ETH and ERC20 token withdrawals, an increase in the referral bonus to 50%, and more. Find out more about all the benefits on the "WBT Overview" page and in our article at the link.
- Information about the Referral Program: WhiteBIT’s Referral Program is a powerful tool for users looking to maximize their earnings by inviting others to join WhiteBIT. The Analytical Dashboard allows users to view the number of users they have referred, and the income generated from these referrals.
This helps to understand the impact of their referral efforts and maximize their earnings through the referral program. Tracking referrals and associated income provides insight into the success of referral strategies, enabling users to optimize their approach for better results. Learn more about all the benefits on the "Referral Program" page and in our article at the link.